
Patterns emerge quickly once placed in a visual context. This allows you to analyze faster a problem at a much deeper level.

Let Velociraster help form a modern data visualization strategy. Proper techniques for dealing with volume, data formats, varied sources, theory and more.
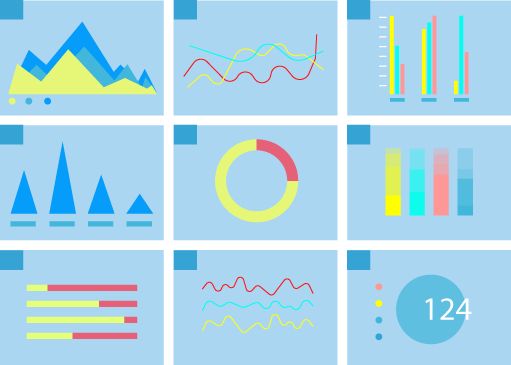
Strengthen your dashboards with the right types of visualizations. You'll never see the big picture if you're looking at your data the wrong way.
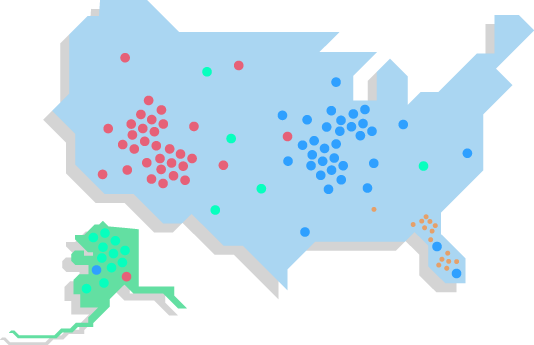
Geographic Information Systems can be a powerful way to visualize and analyze data in a map-focused setting.
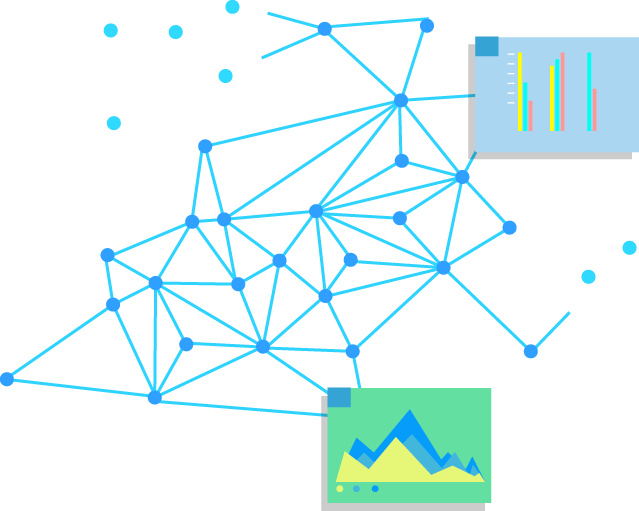
How big are the sets of data? How fast is data coming in? Solving visualization problems with big data takes extra care to ensure answers aren't lost in the noise.
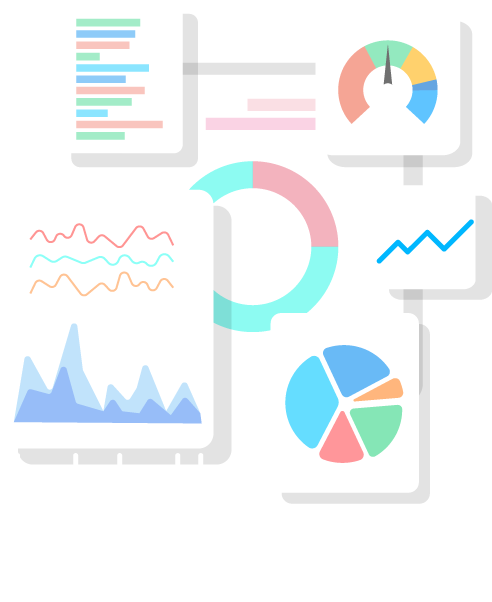
Big data is cool and exciting, but it's not for everybody. Everyone uses small data daily. Do you have a pile of Excel docs that are screaming to be seen? Data you see every day has a wealth of hidden power you might want to be utilizing.
Pinpoint emerging trends and identify relationships and patterns that exist in the business data you already have.

Integrate tailored data visualizations into any type of report. Whether you need to upgrade your automated report systems or need a custom visual to insert into a document you are writing, Velociraster has you covered.

Whether you want help tightening up presentation materials in Excel, PowerPoint or Prezi, or more intricate custom or interactive visualizations for your audience, we are here to help in whatever capacity you need. Big or small.
Immerse yourself in a world of data. Look in all directions and interact with your data in ways you never have before.
